
Congress can tell you, to the dollar, what a new program will cost over ten years. It’s much harder to answer a simpler question: how much regulation are we adding—or subtracting—when we change the rules of the game?
We treat fiscal policy like a ledger. We treat regulation like a weather report: lots of feelings, few numbers.
That is not because regulation is unimportant. It is because regulation is text: messy, unstructured data that are historically difficult to use as input in an economic model or even a spreadsheet.
I launched the RegData project to change that. The goal is to make regulation measurable enough that researchers can study it, and policymakers can manage it, with something closer to the discipline we already demand in budgeting and economics research.
What RegData measures
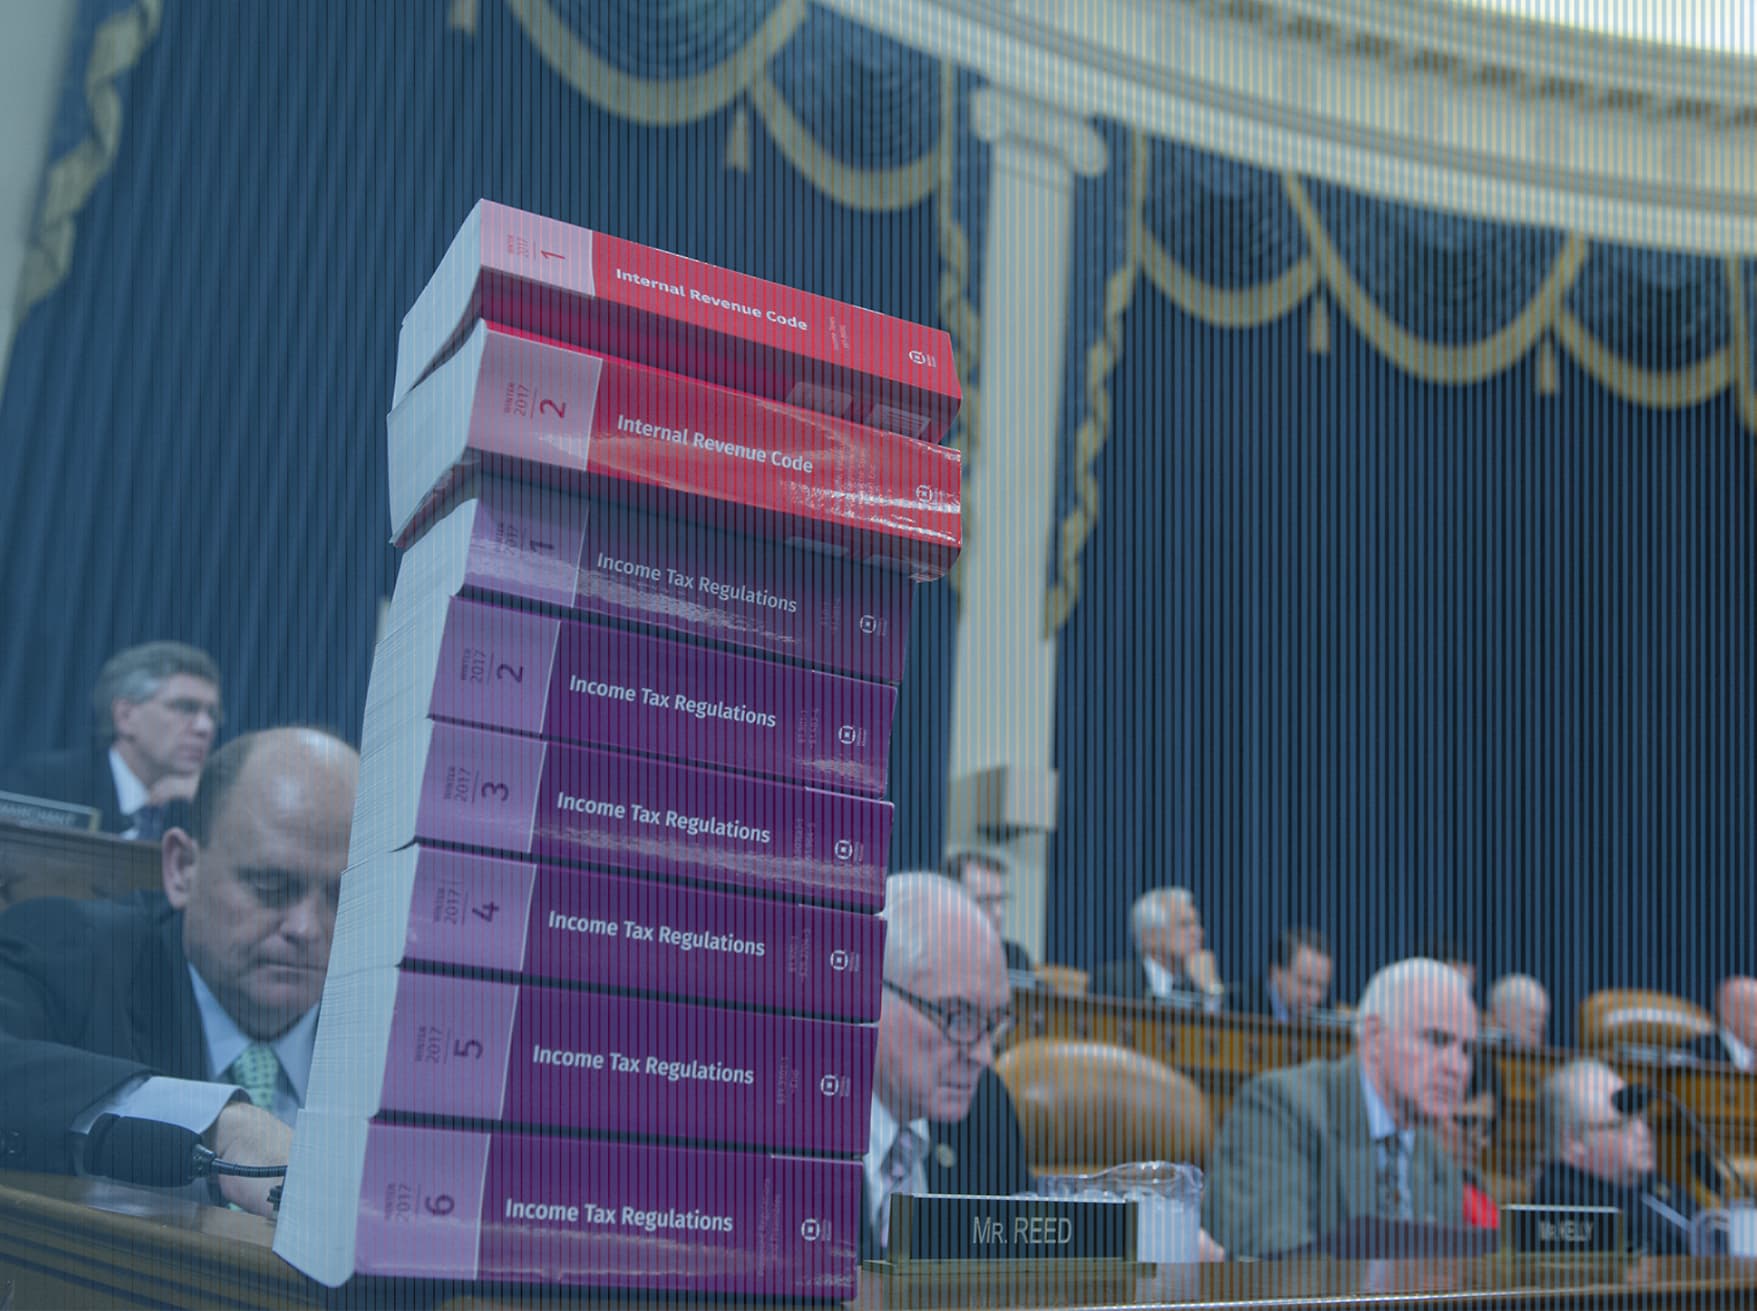
Start with a basic fact: regulation is written down. It lives in millions of words in the Code of Federal Regulations, state administrative codes, and local municipal codes.
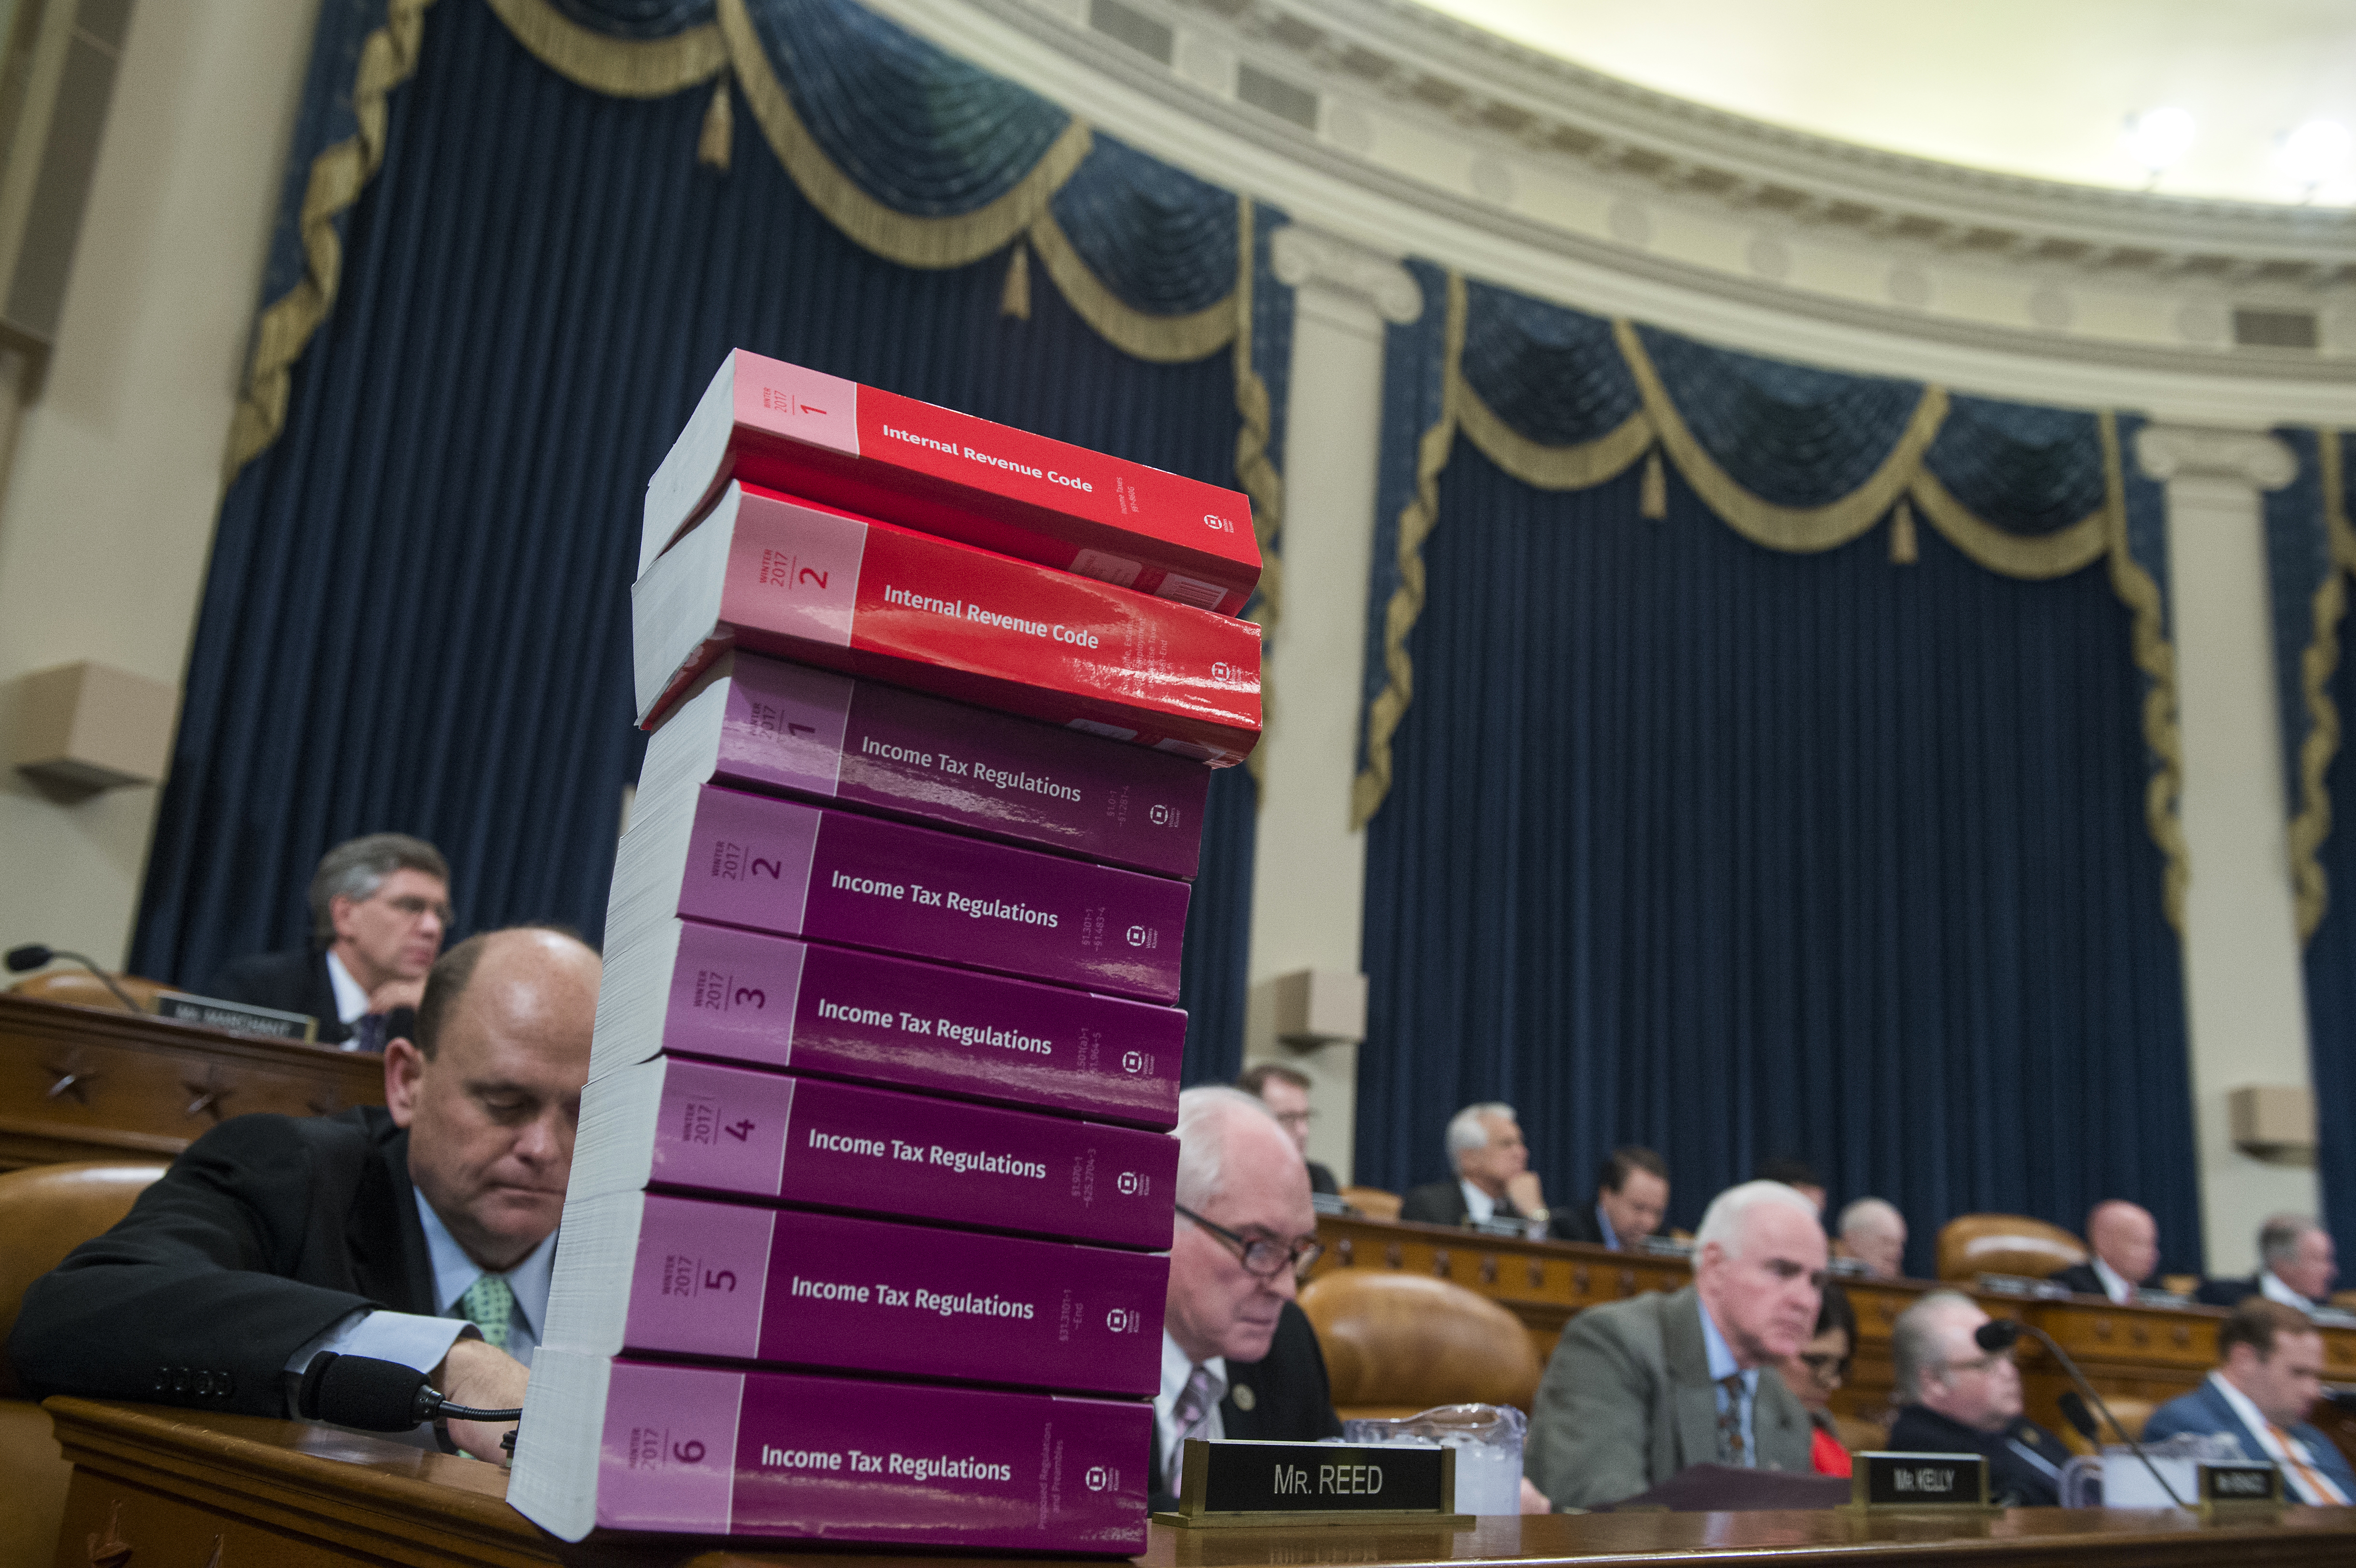
RegData treats that legal text as data. Rather than counting pages, I devised computer programs that count a more policy-relevant unit: restrictions—instances of binding language such as “shall,” “must,” “may not,” “required,” and “prohibited” that typically signal obligations or prohibitions in regulatory text.
No metric is perfect. Not every “must” carries the same cost. But restrictions are consistently observable, comparable over time, and closer to what most people mean when they talk about regulatory burden than raw page counts.
RegData also measures where regulation lands. It uses AI to link regulations to the industries that the regulations affect, so we can see how the stock of regulatory requirements is distributed across the economy rather than pretending it is evenly spread. The end results is a multi-industry, multi-decade dataset on regulation that is objective, replicable, and comprehensive.
This is a major breakthrough because now we have variation to study. For example, we can examine the effects of regulation on employment by comparing heavily regulated industries to less regulated industries.
From a dataset to usable infrastructure
A dataset matters only if people can use it. QuantGov (short for quantified governance) is the public-facing layer that keeps RegData and other text-based measures accessible, documented, and updated.
QuantGov is built on a practical observation: policies (not just regulations) create far more text than any team can read, summarize, and cross-reference by hand.
Quantification is not a substitute for judgment. But it is the only way to scale judgment.
In that sense, QuantGov is at its core research infrastructure: tools that help analysts translate massive bodies of policy text into variables that can be tracked, tested, and compared.
Policy influence
The most important milestone for any measurement project is adoption—when institutions start treating it as a legitimate input, not a curiosity.
Here are three concrete examples that matter because they sit at different choke points of policy-making: macro policy discussion, congressional analysis, and state-level reform.
The Federal Reserve: measurement becomes a macro input. In a January 14, 2026, speech on regulation and the supply side, Federal Reserve Governor Stephen Miran pointed to “progress in measuring regulation” using advances in natural language processing and highlighted QuantGov as a concrete example—moving beyond page counts toward counting restrictions and quantifying regulations by industry. That is a notable shift: it signals that regulatory accumulation is increasingly viewed as something that can be discussed with evidence, not just asserted.
CBO: regulatory measurement enters scorekeeping. In materials discussing its work, the Congressional Budget Office has noted that it “relied in part on RegData—a database linking federal regulations to industries” in its analysis of H.R. 1. That single sentence matters because CBO is the institution Congress leans on for neutral analysis; if regulation can be measured well enough to appear in that analytical machinery, it is less likely to remain an unscored, untracked policy lever. See the CBO blog post and the related CBO presentation.
Texas, Virginia, Idaho, Ohio, and more states: measurement as a reform baseline. In April 2025, when Texas created the Texas Regulatory Efficiency Office, Governor Greg Abbott cited one of my studies that, using RegData, showed that Texas was the fifth most regulated state in the country, with 274,469 regulatory restrictions in its administrative code (See reporting and the underlying policy brief). Virginia, taking inspiration from the RegData approach, has spent the past four years inventorying its regulatory restrictions and tracking progress toward its goal of cutting red tape by 25 percent (it actually topped that—cutting about 33 percent by the end of Governor Glenn Youngkin’s term). Several other states, including Idaho and Ohio, have overtly followed the RegData methodology for similar red tape reduction. This is what progress looks like: reform debates anchored to quantitative baselines that can be checked after the bill-signing ceremony. The business adage, “What gets measured, gets managed,” is also true in government.
When regulation is treated as unmeasurable, reforms are easy to announce and hard to verify. When regulation is measurable, reforms can be audited. Targets can be set. Tradeoffs can be debated in the open.
It also makes better questions possible. Instead of arguing about regulation in the abstract, analysts can ask: where is accumulation fastest? Which industries are most exposed? Do the burdens land disproportionately on smaller firms and lower-income households? Are any types of regulations working better than others?
Once you have a stable metric, you can start experimenting with institutions that impose real constraints on the growth of the rulebook—including regulatory budgets, offset requirements, and systematic retrospective review. Those tools are not magic. But they are much harder to design (and much easier to game) when nobody can even agree on what is being counted.
Regulation, like all policies, will always require judgment. But judgment works better with instrumentation.
A free society needs feedback loops
Free societies need more than rules. They need the ability to revisit, revise, and retire rules when the world changes or when accumulation turns a reasonable requirement into a barrier.
That is ultimately what RegData and QuantGov are for: building feedback loops around the administrative state. The dirty secret of the regulatory state is that for most regulations, we simply don’t know if they are working—if they are delivering the desired benefits at a reasonable cost. By measuring the stock of regulation and how it changes over time, we can move from rhetoric to accountability.
Patrick A. McLaughlin is a research fellow at the Hoover Institution, a visiting research fellow at the Pacific Legal Foundation, and an affiliated member of the Frankfurt Competence Center for German and Global Regulation (FCCR) at the Frankfurt School of Finance & Management. His Substack, Third Order, focuses on regulation and reform.